
UX Design + Analytics
How to Use Data and Analytics to Make Better UX Decisions
UX basics and processes

Imagine building a bridge. You wouldn’t build it without checking the load, materials, and traffic flow, would you? It’s similar with digital products. Data gives us a real picture of how users actually use our product, not just how we think they should.
The purpose of this post is to clarify the process. I will explain when, how, and why to incorporate analytical insights into UX decision-making, and how it directly affects the quality of design and your business results, from increasing conversions to strengthening loyalty. If terms like wireframe or persona are unclear to you, review the basic UX/UI and Design Terminology.
The Role of Data in the Modern UX Process: The End of Assumptions
In the traditional approach, the UX process was often linear: Research, then Design, and finally Implementation. Today, it’s a cyclical, iterative process, where analytics plays a crucial role in every phase.
Data as a Guide for Iteration
Data is your compass. It directs you on what to do next. Data-driven design involves continuous collection, analysis, and application of data.
Before Design (Research): We use them to define problems. Which part of the conversion flow is “leaking”? Which pages are users leaving en masse (bounce rate)?
During Design (Prototyping): Data from previous tests or existing products is used to develop the prototype. For instance, if mobile users do not see the crucial “Add to Cart” button, the prototype will correct that.
After Implementation (Measuring): This is the most important. Measure the impact of the new change. Did the redesign really improve the desired conversion metric?
When you stop relying on “I think this would be better” and start focusing on “Data shows this is better,” you radically elevate the quality of design.
User Behavior Analysis Leads to Better Design Decisions
User behavior analysis isn’t just looking at numbers. It’s deciphering why users behave in a certain way.
Key Metrics for Optimizing User Flow
To make the right UX decisions, you need to track the right metrics. They are divided into Active (what the user is doing) and Passive (the result of those actions).
Conversion Rate: The percentage of users who complete the desired action (purchase, sign-up, download). This is the most important business outcome of UX.
Drop-off Rate: Where users abandon during key flows (registration, purchase). UX design focuses here on reducing friction.
Retention: How many users return to the product. Good UX is key to loyalty.
Time on Task / Effective Passage: How long it took the user to complete the key action. Faster = better user experience.
By analyzing the customer journey map and tracking these metrics, you know exactly where to invest design effort. For example, if you have a high Drop-off Rate at the payment step, the solution isn’t changing the font but simplifying the data entry form.
For a complete insight into business impact, read why UX design is a secret weapon for marketing and conversions.
Applying Qualitative and Quantitative Data
Successful UX decisions require balance. You need to know what is happening (quantitatively) and why it’s happening (qualitatively).
Quantitative Data: What (and Where) is Happening?
Quantitative data are numbers, statistics, metrics from tools like Google Analytics, Mixpanel, or Adobe Analytics.
Role: They answer the questions how much, where, and when. They reveal anomalies, trends, and pinpoint the problem.
Examples of tools: Heatmaps, Scrollmaps, Funnel Analysis.
Quantitative analysis tells you: "55% of users leave page X. Analytics often reveals 10 design mistakes that drive away customers."
Qualitative Data: Why is it Happening?
Qualitative insights are direct feedback, observations, and opinions from users.
Role: They answer the questions why, how, and what the user thinks/feels. They uncover motivations, pain points, and context.
Examples of tools/methods: User testing, Interviews, Surveys, Session recordings.
Qualitative analysis reveals, for instance: "Users leave page X because the address input field is confusing."
Rule: Always use quantitative data to identify the problem, and qualitative data to understand the cause of that problem.
How to Properly Test Data-Driven Hypotheses (A/B Testing)
Once data indicates a problem and you gain qualitative insight into the cause, it's time for data testing — forming a hypothesis and testing solutions.
Defining a SIMPLE Hypothesis
A good hypothesis always follows the format:
If we change X (variable), it will result in Y (expected change), leading to Z (business outcome).
Bad hypothesis: "We are redesigning the entire checkout process; it will probably be better."
Good hypothesis: "If we move the 'Sign In' button from the menu to the homepage (X), we expect to increase the registration conversion rate by 10% (Y), which will improve retention of new users (Z)."
Practical A/B Testing
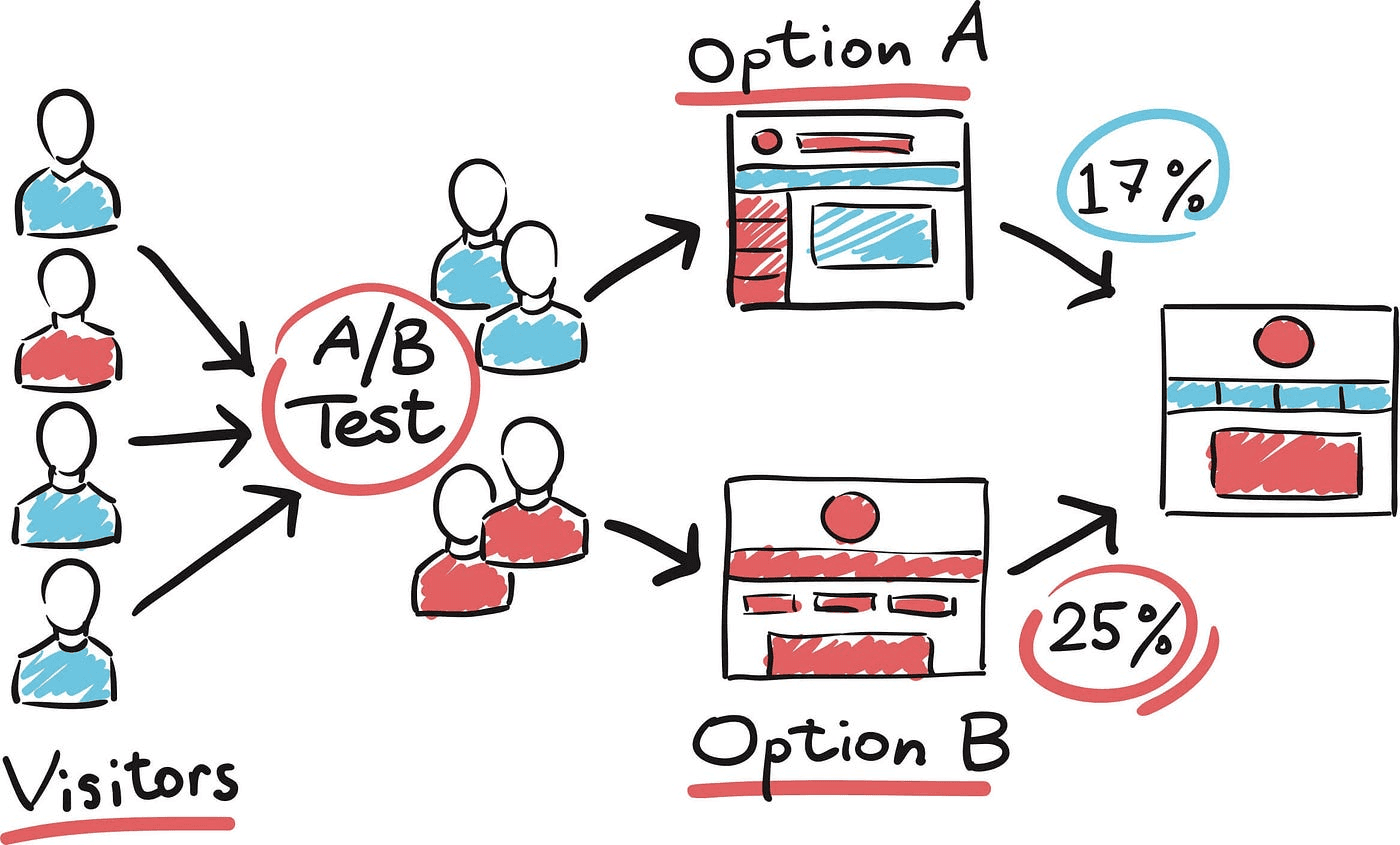
A/B testing (or Split Testing) is the gold standard for data testing.
Set up the test: Split traffic between the control version (A - current design) and the variant (B - your proposed solution).
Measuring: Let the test run until you achieve statistical significance (usually requires thousands of visitors and a sufficient number of conversions). Do not stop the test early!
Analysis: If variant B outperforms version A in key metrics, the hypothesis is confirmed and the change is implemented.
Remember: Even a negative test result is valuable data! It tells you that your solution is wrong, but the problem still exists. Keep iterating.
Practical Examples of Analytics-Based Optimizations
Data turned into action is powerful. Here are some common scenarios:
Analytics Insight | UX Design Decision | Business Outcome |
Quantitative Insight: 70% of users click on the title before entering a search in the field. | UX Solution: Remove the title and focus solely on the empty search field (Search Bar) with placeholder text. | Increased number of active searches and reduced time to find products. |
Qualitative Insight: Users in surveys say they do not see the money-back option. | UX Solution: Place a clear link to the refund policy directly next to the purchase button. | Increased trust, reduced doubt, and a rise in conversions. |
Quantitative Insight: Mobile users struggle with typing their email address and make mistakes. | UX Solution: Use fields with automatic recognition and autofill function, and introduce passwordless login. | Reduced Drop-off Rate at the registration/login step. |
How to Present Data to Stakeholders
Presenting data to management and stakeholders requires shifting from numbers to business value.
Focus on the story: Don’t just present charts. Say: "Because of this issue (data from analytics), we did this solution (UX decision), and it resulted in this outcome (increased conversion by X%)."
Use Business Language: Instead of saying "We reduced latency by 200 ms," say "We shortened the loading time, which increased the conversion rate on mobile devices and brought in X euros more in revenue."
Be Transparent: Show unsuccessful tests too. This demonstrates that you are methodical and learning from data rather than guessing.
Next Steps: Finish with a clear action plan (roadmap). What is the next priority problem we will solve?
Integrating analytics and data is not an option, but a fundamental need of modern UX design. When you use quantitative data to identify the problem and qualitative insights to understand the cause, you gain the most powerful tool for decision-making.
Data-driven UX design is not a compromise between aesthetics and functionality; it’s an intelligent balance of the two elements. The result is a product that not only looks good but also solves real user problems and delivers measurable, positive business results.
Start today: identify one “most painful” part of the user flow, formulate a hypothesis, and test it. Visible Data-Driven progress will follow quickly.