
Most people leave an online purchase before paying. Here is what I found in session recordings on a real shop, what I changed, and what you can check on yours.
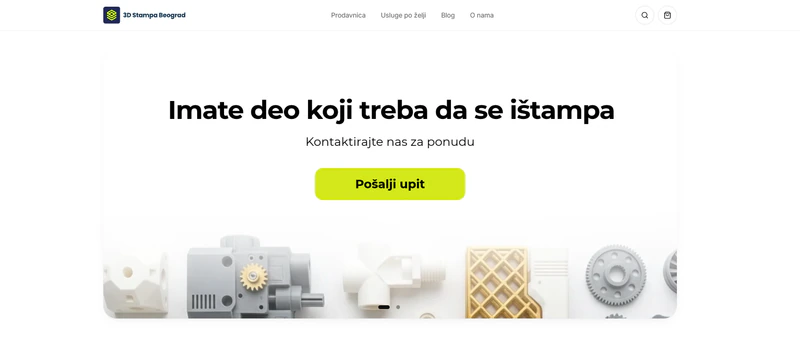
General UX advice for online stores is easy to find. What you see less often is a concrete example: what exactly was tripping up customers, how it was noticed and what was changed. That is why I am writing here about the family shop 3dstampabeograd.rs, which I built myself and whose changes I manage. I am not claiming design is the only reason for the good results, but every change below came from something that was visible.
The store I use as an example here is small and family run: 3D printing, our hobby business that moved from classified ads to its own webshop. The products are slava molds, a purchase that happens once a year and often at the last minute. The customer has a few seconds to see their saint, the deadline and the buy button. That is exactly why it is a good example: when the moment is that short, every snag shows immediately. You can see the whole project in the case study 3D Stampa Beograd: from classified ads to a webshop that sells.
Why people don't finish a purchase
Baymard Institute combined 50 studies published between 2006 and 2025. According to their list, the average cart abandonment rate is 70.22%. Among people who were not just browsing, the reasons are:
- Extra costs too high (shipping, tax, fees): 40%.
- Delivery too slow: 20%.
- Not trusting the site: 19%.
- Being forced to create an account: 18%.
- Checkout too long or complicated: 17%.
These are not my store's numbers, but a picture of the world showing where purchases are most often lost. That is why I looked at exactly those places: the product page, the delivery deadline, the cart and the checkout.
First look at where people actually sit
In the first seven weeks the store had 3,224 visitors, and 2,717 of them, about 84%, were on a phone. So everything starts on a small screen: if something doesn't work there, it doesn't work for most customers.
For what numbers don't show, I used session recordings and scroll maps in Microsoft Clarity. Numbers say that someone left, and a recording shows what they did before that. Most of the problems below were spotted in those recordings, and the rest in conversation with the owner and in the orders.
Six problems and what I changed
1. The buy button was too far down
On a phone the button sat below a long product description, and fewer than 10% of visitors scrolled to it. A customer who can't see how to buy doesn't ask, they close the page.
What I did: I added a buy bar visible from the first screen and shortened the description with a "Read full description" option. The full text stays in the page code, so nothing is lost for search.
2. The surname field was hard to change
With every set the customer gets a gift mold with the family surname, so the surname is part of the purchase. In one recording a customer added the same set to the cart three times just to enter or correct the surname.
What I did: the surname field now sits in both the cart and the checkout, with automatic saving. The customer doesn't have to go back to the product page.
3. The delivery deadline wasn't clear enough
A slava has an exact date, so the most important question for the customer is whether it will arrive on time. According to Baymard, slow delivery is the second most common reason for abandoning. A customer who doesn't know the deadline postpones the decision, and a product bought once a year can't afford postponing.
What I did: every slava has an order deadline, and the product page shows a short card with it. The customer knows right away whether it will arrive.
4. Checkout errors were hard to see
When a field wasn't filled in correctly, the message was easy to miss, so people thought the button didn't work.
What I did: the field now gets a red outline and a clear message, and the page scrolls to the error on its own. The customer sees what to fix and doesn't have to look for it.
5. Dead clicks after the order
On the thank you page customers clicked the names of the products they had just ordered, and nothing happened. It is a small detail, but nothing on the page after a purchase should feel broken.
What I did: the product names became links.
6. The customer didn't know what happens after ordering
After paying on delivery the customer has to wait, and uncertainty turns into calls and messages to the owner.
What I did: I built order statuses and automatic emails: confirmation, "produced" and "shipped" with a tracking number. A customer can also check the status on the site by entering the order number and phone.
What changed
In the first month, with ads and the slava season, the numbers looked like this:
- ≈5x more visits from Google per week than before the changes.
- More than 40% of the people who open the checkout finish the order.
- Two thirds of all sales now go through the site.
I don't attribute all of this to design alone. What I can say for sure is that every change came from real customer behavior, not from assumptions. The numbers come from GA4, Microsoft Clarity and the workshop's order records. The next step is measuring every step in the cart, to see which change contributes how much.
What you can check in your own store
You don't need a special tool to start. Go through this on a phone, as if you were a customer:
- Is the buy button visible right away, without scrolling through the whole description?
- Is it clear what it costs with delivery, before checkout? Extra costs are the most common reason for abandoning.
- Does the customer know when the product will arrive, on the product page itself?
- Is an account forced? Buying without an account is faster.
- What happens when you make a mistake in a form? Is the error visible and clear?
- What does the customer see after ordering? Confirmation, status and an email should reassure them.
If you want a deeper look, the article website UX check in 30 minutes has a list you can go through yourself, and I explained the difference between a check and a full review in the article on the UX audit.
Why I measure before changing
Every change above was an answer to something that was visible, not to personal taste. I wrote about how analytics leads design in the article UX design and analytics: decisions based on data, and about why the phone is the first screen in the article on mobile experience and sales optimization. If you wonder why a site doesn't bring customers despite visits, see why the website does not bring customers.
The webshop was built in Lovable. How I work in that tool and where its limits are I described in the first-hand Lovable guide, and I write about apps and more complex systems in the article UX design for SaaS and web apps.
What next
If you have an online store and suspect people drop off somewhere on the way to the order, send me a link and three things that bother you. I'll look and tell you what I would fix first, with no obligation. You can read more about how I work on the UX/UI design services and UX consulting and audit pages, and you can send me a message through the contact page.